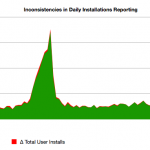
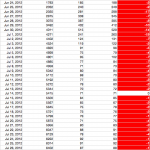
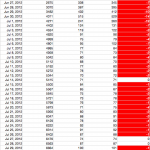
Last week I wrote about the discrepancies I spotted between the number of the daily user installs and the differences between the total number of the user installs for two consecutive days. Those two values ought to match, but they don’t and it seems to be a very random process. Google have adjusted the stats for August 21, 2012 and August 22, 2012, but the smaller discrepancies are still there.
The stats I use are available from the Google Play Developer Console. You need to go there, find you app, click on Statistics and then click on all in the top right corner. Once the graphs refresh, click on Export as CSV and make sure all boxes are ticked. Download the ZIP file, unpack it and import into your favorite spreadsheet.
This article is also available on Amazon Kindle. You may consider buying it, if you would like to keep it for your reference.
You can monitor those stats yourself daily, but it would take up up to an hour of your time, if you were to import that data into a spreadsheet by hand.
I use a simple Python script to pre-process the data before pasting it into a spreadsheet. It saves me a lot of time and I thought it might be a good idea to share that tool with other Android developers, in case you might want to use it. It is also a good example of how using a few standard Python modules can help you save time processing data.
Prerequisites: Python 2.7.1 or later.
You can check which version of Python you have installed on your system with the following command (do not type $):
$ python --versionHere is how I begin my script:
#!/usr/bin/pythonThe first line gives the command-line interpreter a hint to about the location of the Python interpreter on your system. If Python is not located at /usr/bin/python adjust the first line to match your system’s configuration. (This line is an example of what is known as the shebang in Unix scripts.)
Next, we tell Python to import the following four modules:
import argparse
import csv
import re
import zipfile
Here’s what they do:
argparse is used to parse command-line options and arguments, i.e. anything that is listed after the name of the script. It also displays syntax and usage information when the user makes a mistake or uses the -h option. (For more information on argparse consult the official documentation.)
csv is used to read and write Comma-Separated Values (CSV) files, which is the lowest common-denominator file format used to exchange data between different spreadsheets. It is also the format that Google Play publishes your app stats. (For more information on csv consult the official documentation.)
re is the module that implements regular expressions, necessary for filtering text. (For more information on re consult the official documentation.)
zipfile is used to read and write ZIP archives, such as those served by Google Play Developer Console when you click on the Export to CSV link. It can access files inside archives without you having to explicitly unpack them. (For more information on zip file consult the official documentation.)
I will describe those modules in a little more detail later. Let’s have a look at the default values set in the next section:
# define defaults

redate = re.compile('^[0-9]{8,8}$')
redate is a regular expression, a pattern that matches any numeric string expressed using digits 0-9. That string must contain exactly eight digits, e.g. 20120801, but not 20120108a.
To be precise, redate is an SRE_Pattern object returned by the compile() function defined in the re module. Every time you want to use regular expressions, you must first define (compile) the pattern you will be using to match, search, delete, or replace strings with.
rows = []rows is a list that will store the data extracted from the the APPID_overall_installs.csv file. (APPID is the ID of your Android application, e.g. com.example.myapp.)
rc = 0rc is a helper variable. Its use will be explained later.
dui = 0dui stores daily user installs, the numbers extracted from the daily_user_installs column from the APPID_overall_installs.csv file.
ddui = 0ddui is described later.
tui = 0tui stores total user installs, the numbers extracted from the total_user_installs column from the APPID_overall_installs.csv file.
dtui = 0dtui is described later.
Once the defaults have been set, the script can begin parsing command-line options and arguments. To do that it needs to create an argument parser object:
# parse arguments

parser = argparse.ArgumentParser(description='Compare the total number of user app installs with the number of the daily user installs on Google Play.')
An argument parser is an object returned by the ArgumentParser() function of the argparse module. Right now it is just an empty object that doesn’t do much, although if you were to run your script with the -h option, it would display the helper text defined in the description argument of ArgumentParser().
Our script needs to know which ZIP file you wish to use data from and the app ID. We will pass them as arguments of the -f and -a options respectively. Definitions of those options are added to the parser object with calls to the add_argument() function:
parser.add_argument('-f', required=True, action='store', dest='fin',
                    help='the name of the ZIP archive file downloaded from your Google Plus Developer Console')

parser.add_argument('-a', required=True, action='store', dest='appid',
                    help='app ID, e.g. com.example.myapp')
The first argument of add_argument() is the option string, e.g. '-f' defines the -f; the second argument is required, which is set to True for every option that must be set for the script to functions properly.
Next, you need to tell the parser what it should do with the arguments that follow the options. This is specified in the value of the action argument of add_argument(). Since we need to process those values later on, the script needs to store them somewhere. Hence action is set to 'store'.
Once we tell the parser what we want to do with the arguments to the options defined, we need to tell it where it should store those values. The names passed as the values of the dest argument will become the names of the properties of the parser object. They are also displayed in uppercase in the syntax section printed when you run the script with the -h option or when you make a mistake.
The last argument, help defines a short description of the purpose of the option and its argument.
Once all options have been defined, we need to initialize the parser:
args = parser.parse_args()If all goes well, we should be able to read the ZIP archive:
# process the zip file

zf = zipfile.ZipFile(args.fin, 'r')
If the argument of the -f option (stored in args.fin) is a valid path to the ZIP file downloaded from Google Play, we should be able to read it. That’s what we request when we pass the 'r' argument to the ZipFile() function.
Knowing the app ID we can splice together the name of the CSV file inside the ZIP archive represented by zf. The app ID is given as the argument of the -a option and stored in args.appid. That spliced name is passed as the first argument of reader() and the second argument is delimiter, which separates cells in rows. It is set to , for the CSV files generated by Google Play.
# process the CSV file

cf = csv.reader(zf.open("%s_overall_installs.csv" % args.appid), delimiter=',')
The cf object represents the CSV file stored inside the archive represented by zf
We will now read the data, row by row, skipping empty rows and those where the first cell does not mach the regular expression pattern stored in redate.
The rows that pass the tests, are inserted at the beginning of the rows list, which is a way to reverse their order. We do it, because it helps process data later on.
for r in cf:

    if r == []:
        continue

    if not re.match(redate, r[0]):
        continue

    rows.insert(0, r)
We now have a list of rows in reverse order, from the earliest to the latest stats. Now is the time to crunch data:
for r in rows:

    dtui = int(r[4]) - int(tui)
    ddui = int(r[3]) - int(dtui)

    if rc == 0:
        print r[0] + "," + r[3] + "," + r[4]
    else:
        print r[0] + "," + r[3] + "," + r[4] + "," + str(dtui) + "," + str(ddui)

    tui = r[4]
    rc = 1
Because we need data from the previous day to compute the difference between the total user installs of the app, the first row (the oldest entry) needs to be printed with some data missing. This is why we use the rc flag.
So, the first row of the output will contain just three cells:
date,daily_user_installs,total_user_installsStarting with the second row, the output will consist of five cells per row:
date,daily_user_installs,total_user_installs,delta_total_user_installs,delta_daily_total_user_installswhere:
delta_total_user_installs = dtui computed as the difference between the total number of user app installs for today minus the total number of user app installs for yesterday;
delta_daily_total_user_installs = ddui computed as the difference between the daily number of user app installs minus delta_total_user_installs.
I called my script gpstats.py.
To make it executable, you need to run the following command:
$ chmod 0755 ./gpstats.pyWhen you run gpstats.py it should produce a five column output that you need to capture to a file, preferably with a .csv filename extension so you can later import it into your favorite spreadsheet. Remember to redirect it into a file of your choice using the > symbol, e.g.:
$ ./gpstats.py -f com.example.myapp.zip -a com.example.myapp > mystats.csvThe output file can be opened in any spreadsheet application.
You can download the script if you would like to see if you notice similar discrepancies in the stats reported by Google Play.
Have fun!
PS. If you want to learn Python, have a look at these Python programming books.


